Evolution of the Electron correlation function
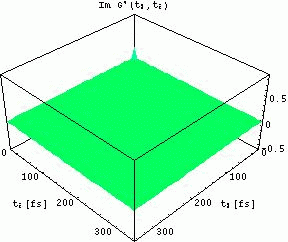
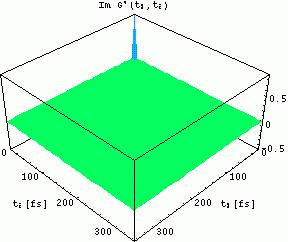
Thermalization of an initial nonequilibrium electron distribution function in a semiconductor, peaked at k=3.5/a_B
Left picture: Momentum k=2.9/a_B - diagonal value of g is increasing
right picture: k=3.5/a_B - diagonal value is decreasing
Watch the propagation of the electron wave away from the time diagonal!
Notice the different oscillation periods across the time diagonal reflecting the different single-particle energies for the two momentum values.
Color code: green=zero, positive values: cyan-blue-pink, negative values: yellow-orange-red