Holes crystallize and melt


When electrons in a solid are excited to a higher energy band they leave behind a "hole" in the original band. Normally, electrons and holes are spread out inside the crystal like a fluid or gas (this is what any textbook on solid state physics tells you). However, this is not always true. Here we show that holes can spontaneously arrange in a regular lattice which is embedded into a quantum sea of electrons.

Interestingly, these hole crystals have a lot in common with distant exotic stellar objects such as White Dwarf stars and neutron stars: they also are thought to contain a lattice of heavy particles (ions) immersed into a sea of electrons.

Yet in contrast to the latter, crystallization of the hole crystal can, in principle, be turned on and off: by "bending" the hole energy band (increasing its curvature) one can lower the hole mass, see the sketch in the figure. If it falls below a critical value (of about 80 times the electron mass, according to our paper) the crystal melts.

Schematic of semiconductor band structure 
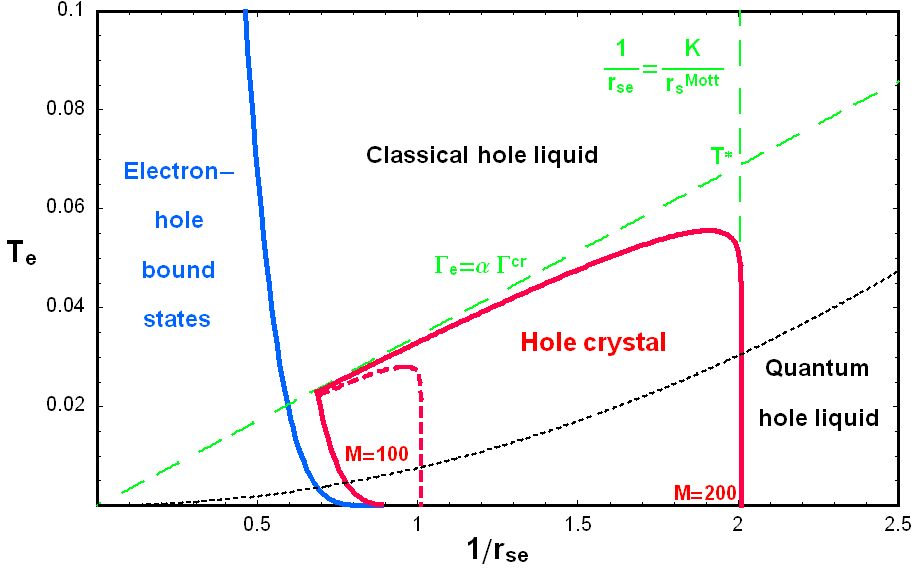
Schematic band structure of a semiconductor (the allowed energy bands versus momentum).

Electrons which are excited (e.g. by a laser pulse) from the valence band to the conduction band, leave a hole in the valence band.

If many electrons are excited at the same time the remaining holes can show gas-like, liquid-like or crystal behavior. Which of these behaviors appears, depends on the hole (valence) band curvature.


Melting of hole crystal by increasing the valence band curvature


Hole crystal (A) Hole liquid (B) Hole gas (C)
Picture of hole Wigner crystal (M=400) Picture of hole liquid (M=50) Picture of hole gas (M=12)
Picture of hole Wigner crystal (M=100) Picture of hole liquie (M=25) Picture of gas  (M=5)

The Picture shows 6 real-space snapshots of the electron-hole system in a semiconductor at low temperature and high density. The electrons (yellow dots) are in all cases in a gas-like state (a quantum Fermi gas). In contrast, the configuration of the holes is modified as a result of a continuous increase of the valence band curvature (corresponding to cases A, B, C above).

A: In the left two figures the holes form a crystal - the hole to electron mass ratio is M=400 (top) and M=100 (bottom).
B: In the middle two figures the holes form a liquid with M=50 (top) and M=25 (bottom).
C: In the right two figures the holes are in a gas-like state with M=12 (top) and M=5 (bottom). This is the typical situation in "normal" semiconductors.

From the bottom left to the upper middle figure, melting is observed even though the temperature remains unchanged. This process is called "quantum melting". Here, it is a consequence of the increasing spatial extension of the holes, when their mass is lowered. As a result, (the wave functions of) neighboring holes begin to overlap. This overlap has the same effect as heating in a normal crystal (such as ice) which causes increasingly strong oscillations of particles eventually leading to a transition to the liquid state (water). The quantum melting is similar as in the case of electron Wigner crystals where quantum melting is caused by compression. In contrast, here, the reason of quantum melting is a reduction of the hole mass which increases the quantum (DeBroglie) wave length of the holes.


Animations
See Animations of the computer simulations results corresponding to three of the snapshots above. Here we also resolve the electron and hole spins (electrons: yellow and blue dots, holes: red and pink dots correspond to different spin orientations). Beware: large files!

hole crystal (M=100, 5 MB)
hole fluid (M=25, 5 MB)
hole gas (M=5, 5 MB)


Right animation shows a combination of the electron-hole state in momentum and real space shown in the figures above. The valence band curvature (mass ratio M) cycles through the values 5-12-25-50-100
Animation due to Gerald Schubert, Univ Greifswald
Schematic of semiconductor band structure and electron-hole configuration


Phase diagram of Two-component Plasma (TCP) Crystals

Phase diagram Phase diagram

Right Figure shows the phase boundary of the hole crystal (full red line) in the temperature (vertical axis) - density (horizontal axis) - plane. The hole crystal exists only in a certain density range and below a critical temperature. When the hole mass is reduced the crystal phase shrinks (see the dashed red line) and vanishes completely below the critical value of the hole to electron mass ratio of about 80. Left Figure shows how the hole crystal relates to other Coulomb crystals in entirely different systems: Classical crystals which have been produced in the laboratory in ion plasmas or dusty plasmas, on one hand, and ion crystals (bare nuclei of carbon, oxygen or iron) expected to exist in the ultracompressed matter in the Universe, such as in the interior of exotic White Dwarf stars or the crust of neutron stars, on the other hand. Our phase diagram (right figure) applies to all these different systems - if the proper specific parameter values (mass and charge ratio etc.) are used.


Our original paper is: M. Bonitz, V.S. Filinov, P.R. Levashov, V.E. Fortov, and H. Fehske, Physical Review Letters, issue of 2 December 2005 (volume 95, 235006).
A Preprint can be found here
More results in J. Phys. A: Math. Gen. 39, 4717 (2006), Preprint
Early predictions and discussions of hole crystals
Official press release | Pressemitteilung

Our research is featured by
- the American Physics Society in Physical Review Focus, see story The Hole Crystal by Kim Krieger
- Pressetext Austria, see story by Wolfgang Weitlaner
- Deutschlandfunk, see interview by Frank Grotelüschen
- New Scientist, see story by Will Knight
- BBC Focus, February 2006, p. 20, story Hole New State of Matter
The quantum electron (one-component) crystal results are published in the article of A.V. Filinov, M. Bonitz, and Yu.E. Lozovik, Phys. Rev. Lett. vol. 86, p. 3851 (2001)
Popular explanation of Electron Wigner crystallization


Startseite