![]() |
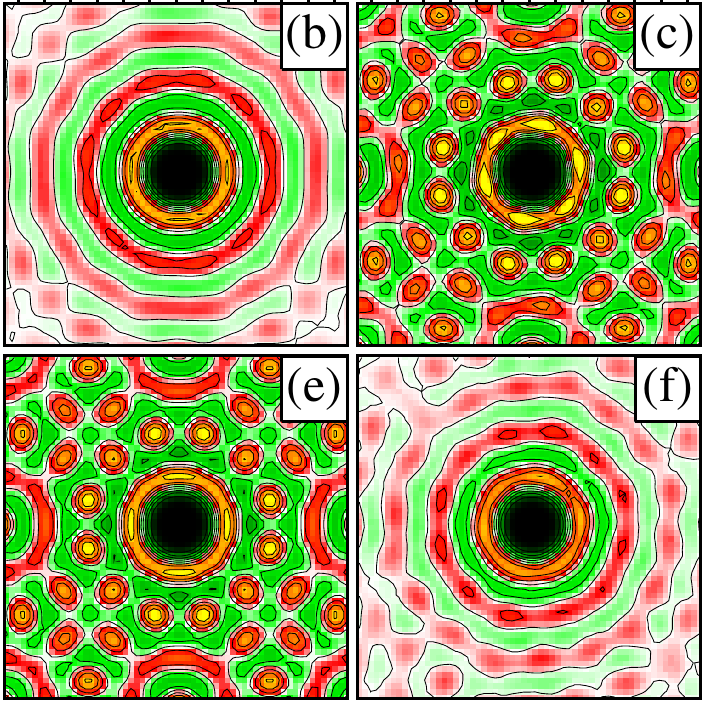
Density distribution (pair distribution function) of the quantum particles (excitons) in the plane of the quantum well. Top left (b): dipolar fluid, (c) dipolar crystal, (e) Coulomb-like crystal, (f) superfluid exciton liquid. Yellow color corresponds to high density, red to lower, green to zero. From top left to bottom right the density is increased at constant temperature. The two quantum phase tansitions persist down to zero temperature. |
![]() |
Phase diagram of 2D indirect excitons for a fixed quantum well width d=13.3,a_B*$. Circles and squares mark our PIMC results. Vertical dashed lines (D=17 and r_s=9.4) indicate the two density induced quantum freezing (melting) transitions. Filled symbols mark the two triple points. The normal fluid--superfluid phase boundary is marked by the red line and is below the ideal estimate T_KT, cf. thick solid line labeled chi=4. The line T_dip marks the freezing transition of a classical 2D dipole system. |