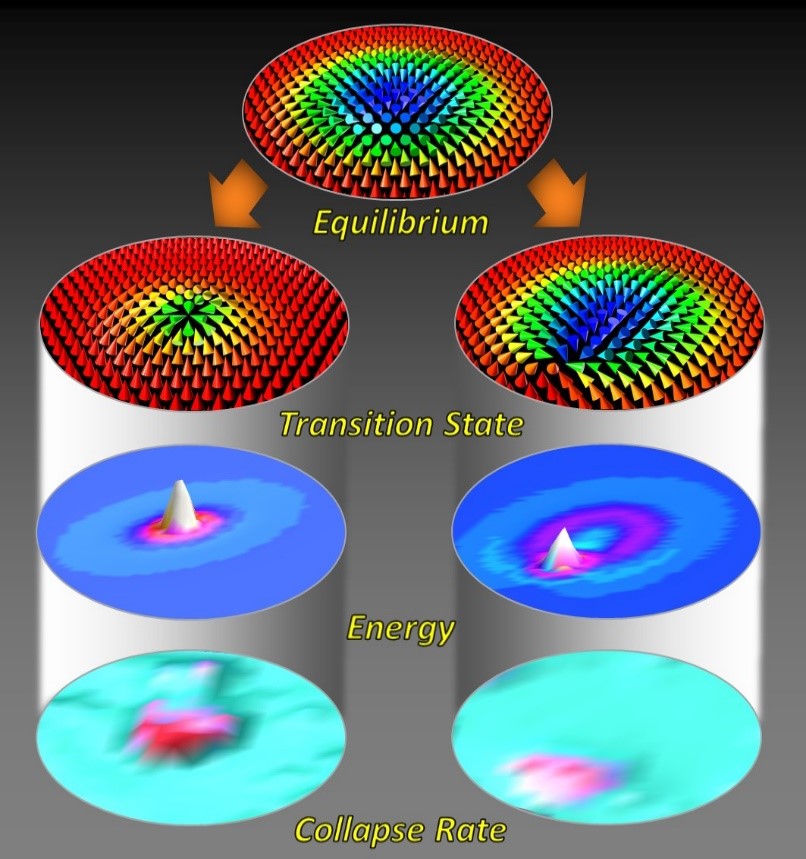
The equilibrium structure of the skyrmion displayed on top (colored cones symbolize the orientation of the atomic magnets)
can decay by two distinct paths (left or right). These paths have been discovered by computer simulations. The transition
structure is shown in the second row. The third row displays the corresponding energy distribution during the transition
with an energy hill marking the decisive reversal of a single atomic magnet. Maps in the lowest row show the transition
rates for both processes. These maps have been de¬termined experimentally by depositing additional electrons at 200 different
positions within the skyrmion and measuring if the nano-knot has been untied by the excess energy of the electrons or not.
(Image: copyright RWTH Aachen).
For more details refer to the following links:
Nature Physics 17, 395 (2021)
Press release of the CAU (2021): How to Untie Magnetic Nano-Knots